

Modeling by RELAP5-3D© System Code of the Instability Transient Occurred on 25th February 1999 at the Oskarshamn-2 BWR
Paolo Balestra, Carlo Parisi, Emanuele Negrenti, Massimo Sepielli - ENEA, Technical Unit for Nuclear Fission Technologies and Facilities, and Nuclear Material Management
DOI: 10.12910/EAI2013-36
The OECD/NEA proposes a new international benchmark based on the Boiling Water Reactor instability transient occurred on 25th February 1999 at the Oskarshamn-2 Nuclear Power Plant (Sweden), with the aim of testing the coupled tridimensional neutron kinetics-thermal-hydraulic (3DNK-TH) codes on a challenging simulation. The ENEA Engineering Simulator Laboratory (UFISST-SIMING) is participating involving a computational model for the RELAP5-3D© code. Currently a complete thermal-hydraulic and 3D neutron kinetics description of the core has been achieved. The simulation results and analyses allowed to fully understand the phenomena, and demonstrated the model suitability in reproducing the instability event with a good level of accuracy.
Several OECD/NEA benchmarks, carried out in the past, have established the validity of the coupled tridimensional neutron kinetics-thermal-hydraulic (3DNK-TH) codes for the simulation of most of the anticipated operational occurrences (AOOs) for Light Water Reactors (LWR).
In particular, benchmarks on the operating Generation II LWR have been carried out. For example:
1) “TMI-1” Main Steam Line Break (MSLB) benchmark [1]
2) “Peach Bottom” Boiling Water Reactor (BWR) Turbine Trip benchmark [2]
3) “Kozloduy-6” Main Coolant Pump transient [3]
4) “KALININ-3” Main Coolant Pump switch-off a Hot Full Power benchmark [4]
5) “Ringhals-1” BWR Stability benchmark (Stability tests simulation) [5]
For the “Stability Benchmarks”, it might be useful to mention also:
6) “Forsmark 1 & 2” BWR Stability Benchmark (Time Series Analysis Methods for Oscillation during BWR Operation) [6]
Now the OECD/NEA proposes a new international benchmark based on the data collected from an instability transient, occurred at the Unit 2 of the Oskarshamn Nuclear Power Plant (NPP) [10], with the aim of testing the 3DNK-TH codes [11] on more challenging situations like diverging thermo-hydraulic (TH) and neutronic (NK) unstable BWR power oscillations, with and without scram. As shown in Table 1, many organizations of various nationalities are participating to this benchmark, demonstrating the strong interest in the validation of 3DNK-TH codes.
Such event is particularly suitable for 3DNK-TH codes benchmarking since the reactivity insertion, caused by the increasing moderator density and by the failure of a control logic, brought the reactor to operate in an unstable region with a generation of power oscillations having a decay ratio greater than one. The transient ended up in a reactor scram because of the large power excursion.
| Organization | Nationality | Organization | Nationality |
|---|---|---|---|
| VTT/Nuclear Energy | Finland | Royal Institute of Technology (KTH) | Sweden |
| Karlsruhe Institute of Technology (KIT) |
Germany | Paul Scherrer Institute (PSI) | Switzerland |
| GRS | Germany | Pennsylvania State University (PSU) | USA |
| AREVA | France | University of Illinois | USA |
| ENEA | Italy | University of Michigan | USA |
| GRNSPG/University of Pisa | Italy | General Electric – Hitachi (GEH) | USA |
| Universitat Politècnica de Valencia (UPV) |
Spain | OKG AB | Sweden |
The Nuclear Engineering Simulator Laboratory (UFISST-SIMING) of the ENEA “Casaccia” Research Centre participates in this benchmarking activity, using the US-developed Best-Estimate (BE) RELAP5-3D© system code [12]. This paper presents a summary of such activities and is structured as it follows. In the next paragraph, the BWR coupled neutronic/thermal-hydraulics instability phenomenon [7] [8] [9] is briefly described while; then, the Oskarshamn-2 (O-2) event description is reported. Further on, the developed 3DNK-TH model and auxiliary software for handling the large amount of geometrical data and for performing the CASMO code [13] cross section libraries interpolation is described. Afterwards, the steady state and the O-2 instability event analyses are reported. Finally, the conclusions are presented.
The BWR coupled neutronic/thermal-hydraulic instability
The BWR coupled neutronic/thermal-hydraulic instability events consist in neutronic and thermal hydraulic core parameters (power, coolant flow, void fraction, etc.) oscillations induced by an initial perturbation.
Figure 1 shows as the initial low flow perturbation trigs two delayed feedback effects, a decrease in the channel pressure drop (TH feedback) and a lower power generation (NK feedback) caused by the consequent higher void fraction. The reduced channel pressure drop induces an increase in the inlet flow, causing a reduction of the void fraction. Thus, the increased mass flow increases the pressure loss again, just as the decreased void fraction causes an increase in the local power (NK feedback). Such oscillations can be decreasing, stable, or diverging, depending on the magnitude and the time constants of each one of the involved core parameters (fuel heat capacity, channel pressure drop, void coefficient neutronic feedback, ...).
The occurrence of such a phenomenon with diverging oscillations is avoided by operating a BWR outside the red/orange zones reported in the Power-Flow Map of Figure 2. In fact, if the reactor is accidentally operated into such zones, also the reactor noise is sufficient to trig the diverging instabilities. The Power-Flow Map thresholds (i.e., the reactor stable domain) depends on the aforementioned reactor parameters as the negative void neutronic feedback, the fuel heat conduction, the axial power shape, etc.
Event description
The O-2 NPP is a 1700 MWth BWR. On February 25, 1999 a maintenance work was performed on the switchyard. After finishing this task, the normal electric supply was restored, during which the power supply to a bus bar was unexpectedly interrupted for 150 milliseconds.
This caused a “load rejection signal” in the plant logic, causing a turbine trip. However, due to a failure in the relay circuit, the “load reject” signal was never transmitted to the reactor, which continued to operate at full power.
Because of the turbine trip and opening of the steam line bypass valves, the feedwater preheater system was no longer functional and the feedwater temperature decreased by 75 °C over a period of 150 seconds.
The injection of such cold water into the reactor generated a positive reactivity feedback, increasing the core power level. A pump controller reduced the main recirculation flow when the reactor power increased more than 2% above the nominal power, thereby reducing the power.
The pump slowdown was performed three times, yet the core power level continued to increase because of the cold water injection. Thus the operators reduced the reactor power by fully inserting 7 predefined control rods and by further decreasing the core flow.
The reactor power was at 65% and the core flow at 3200 kg/sec, with a continue injection of cold feedwater. Thus the reactor entered into the “instability zone” of operation (see Figure 2), with a self-sustained and diverging core-wide parameters oscillations.
The reactor power started to oscillate with increasing amplitudes over a period of 20 seconds. The reactor scrammed due to high power at 3 minutes and 6 seconds after the initial load rejection event, when the power exceeded 132 % at 2500 kg/s recirculation flow. The event was not of safety concern because of prompt actuation of the safety control system.
RELAP5-3D© modeling
In O-2, the core power is generated in 444 Fuel Assemblies (FA) and is removed by a nominal recirculation mass flow rate of about 7700 kg/s. The core presents some heterogeneities since FA of four different fuel vendors are employed. Coolant recirculation is obtained by four external recirculation loops, each one equipped with a recirculation pump (no internal jet pumps). CASMO code [13] Cross Sections (XSecs) libraries interpolation and pre- and post-processing data were performed using in-house developed tools. The calculation scheme used is reported in Figure 4.
Cross-section database & interpolation
The plant XSecs data supplied by the benchmark organizers are in the CASMO code format [5], which is not compatible with NESTLE, the RELAP5-3D© 3DNK routine. The CASMO data files provide different XSecs values, parameterized as a function of the FA history variables and of instantaneous variables. The history variables that are taken into account include the Burn-Up (BUP) and the burn-up averaged moderator density (HRHO). The instantaneous variables taken into account are the moderator density (RHO), the fuel temperature (TFU), the moderator temperature (TMO), and the CR position (ROD). In NESTLE code (Figure 4), each 3DNK node needs to carry out the information defining the neutronic history and behavior of the considered part of an FA. Therefore a suitable base cross-section and four variation coefficients have to be input into the code.
The PROMETHEUS tool was developed for performing CASMO libraries interpolation, deriving base XSec and their variation coefficients using a cubic spline interpolation and least square method. An automatic calculation of the deviation between interpolated data and the original XSec libraries data is also performed for verification purposes.
The PROMETHEUS workflow is given in Figure 5. Boundary conditions for performing the interpolation are provided for defining the February 25, 1999 event.
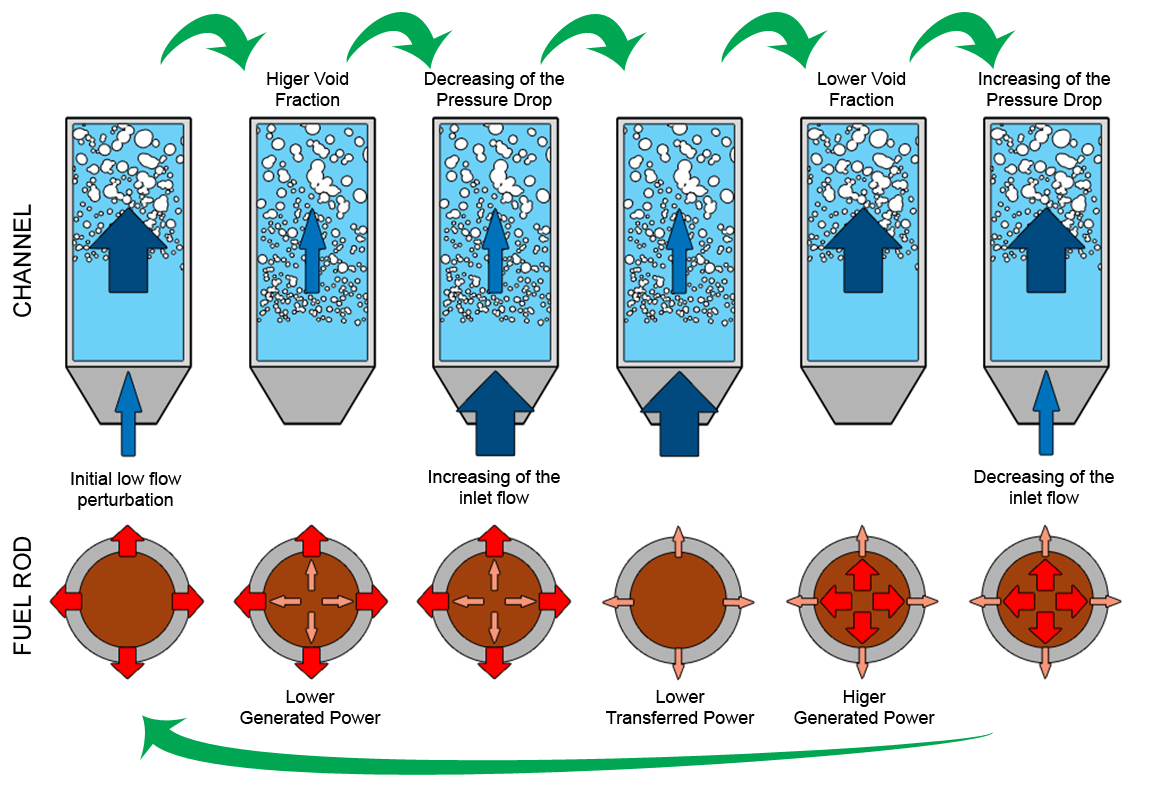
FIGURE 1 - Coupled Neutronic/Thermal-hydraulic instability mechanism
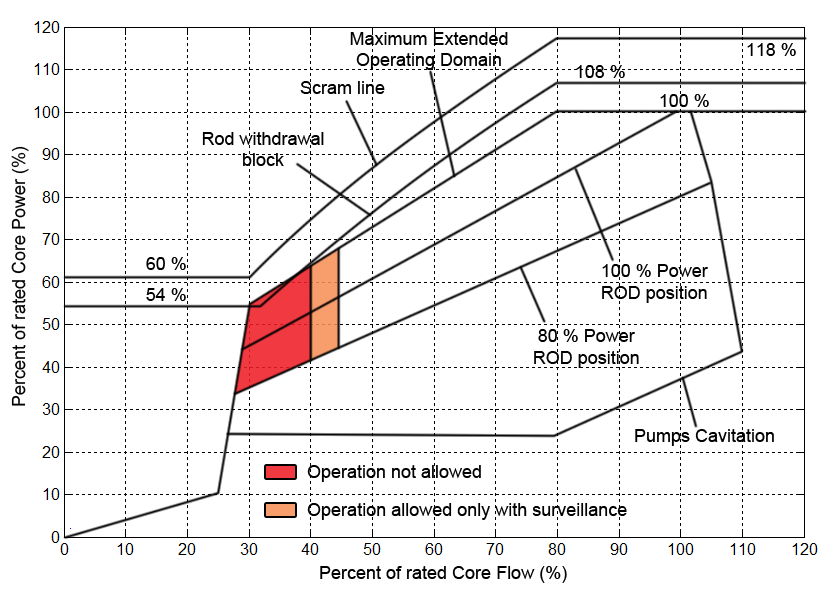
FIGURE 2 - Typical BWR Power-Flow map
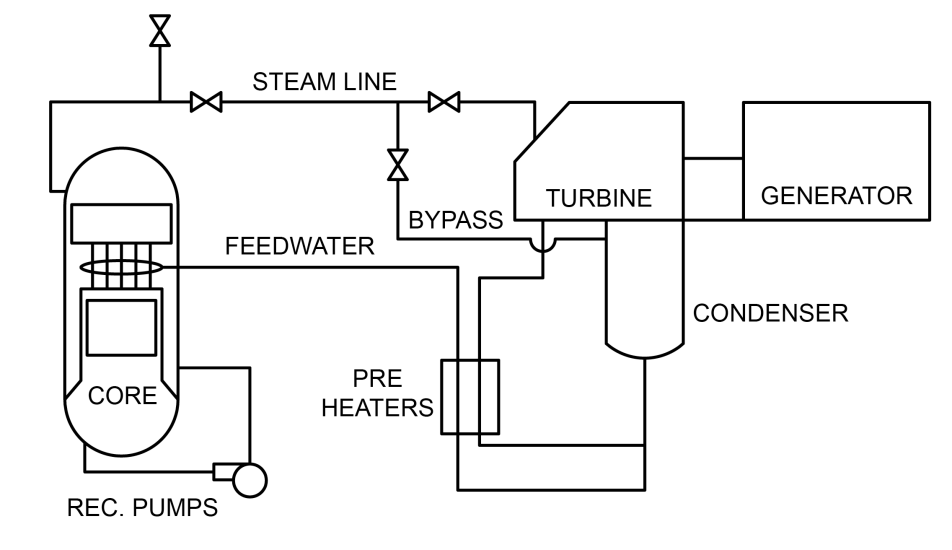
FIGURE 3 - Simplified BWR scheme
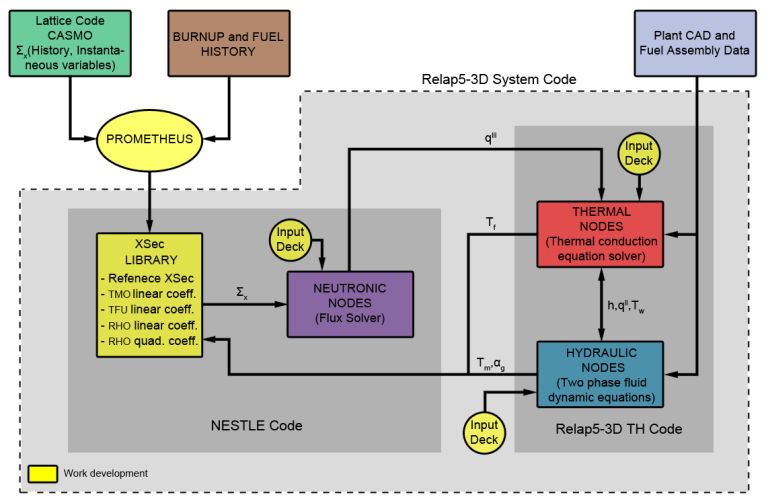
FIGURE 4 - Calculation scheme
Cross-section database & interpolation
The plant XSecs data supplied by the benchmark organizers are in the CASMO code format [5], which is not compatible with NESTLE, the RELAP5-3D© 3DNK routine. The CASMO data files provide different XSecs values, parameterized as a function of the FA history variables and of instantaneous variables. The history variables that are taken into account include the Burn-Up (BUP) and the burn-up averaged moderator density (HRHO). The instantaneous variables taken into account are the moderator density (RHO), the fuel temperature (TFU), the moderator temperature (TMO), and the CR position (ROD). In NESTLE code (Figure 4), each 3DNK node needs to carry out the information defining the neutronic history and behavior of the considered part of an FA. Therefore a suitable base cross-section and four variation coefficients have to be input into the code.
The PROMETHEUS tool was developed for performing CASMO libraries interpolation, deriving base XSec and their variation coefficients using a cubic spline interpolation and least square method. An automatic calculation of the deviation between interpolated data and the original XSec libraries data is also performed for verification purposes.
The PROMETHEUS workflow is given in Figure 5. Boundary conditions for performing the interpolation are provided for defining the February 25, 1999 event.
The 3D NK Nodalization
The 3D NK model includes a full core description. All the 444 FA plus the bottom, the top and the radial reflectors are individually simulated. For the active core simulation, 25 uniform axial meshes are used, plus 1 mesh for the bottom and top reflectors. The radial reflector is modeled by 27 axial meshes as well. Coupling with the RELAP5-3D© TH model is achieved by employing an one-by-one mapping between the 3D NK node and the corresponding TH node. Finally, the whole core neutronic simulation is achieved by using 14472 NK nodes. Figure 6 shows a sketch of the 3DNK nodalization.
The TH Nodalization
The four recirculation loops were collapsed in one equivalent TH loop, scaling the pump characteristics and the pipes cross-sectional flow areas. The same was done for the four steam lines (SL) and the four feed water lines (FW). The passive heat structures (vessel, barrel, etc.) were not simulated. Particular care was devoted to the core simulation, in order to consider all the relevant phenomena involved in the instability event (axial and radial power distribution, channel pressure drops, channel-to-channel interactions, etc.). Therefore all the 444 core FA are modeled by 222 TH channels using the core anti-symmetry and coupled to the corresponding 3D NK nodes via the developed mapping scheme. The core active length is simulated by using 25 axial meshes with size proportional to the max dominant phase velocity (i.e., larger meshes at the top and finer to the bottom) to keep the Courant Number as close as possible to the unity, thus minimizing the numerical diffusion. Also the inlet and outlet core volumes are modeled with particular care by using a pseudo-3D modeling, based on 110 interconnected branches. An example of a single channel nodalization and of the whole TH nodalization is shown in Figure 7.
The total number of hydraulic volumes used to model the reactor, not including the core and the bypass, is 489. The 444 core channels and the reflector are instead modeled by 6467 hydraulic volumes. To model the core power generation into the fuel, 5550 heat structures were used.
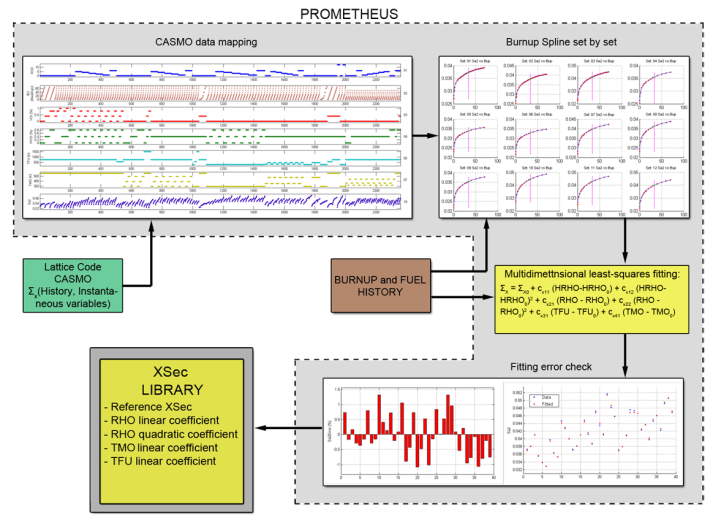
FIGURE 5 - PROMETHEUS XSec interpolation scheme
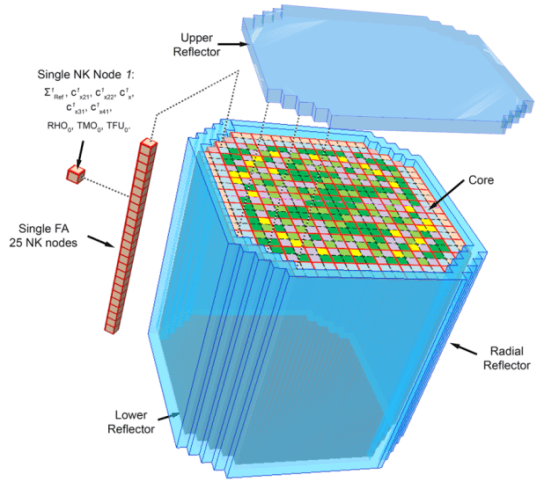
FIGURE 6 - 3D Core NK nodalization
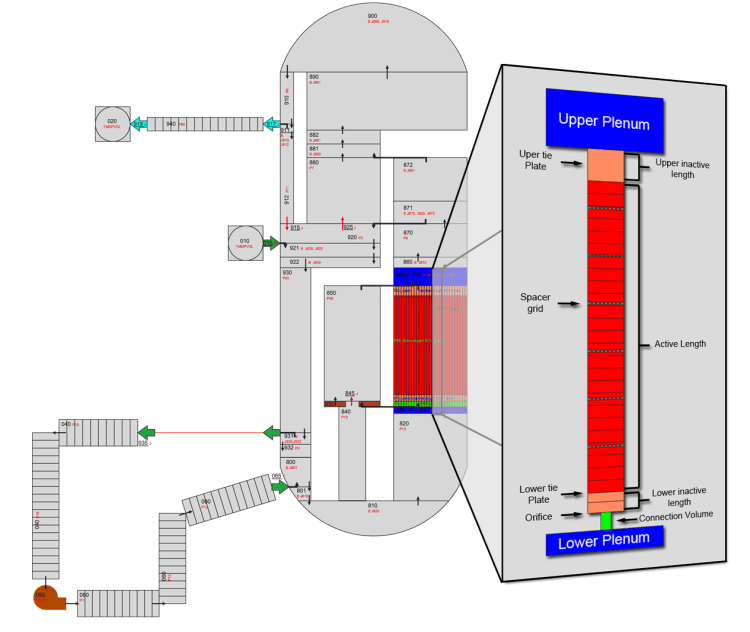
FIGURE 7 - Reactor and single channel TH nodalization
Results
Steady state analysis results
The results of the steady state (SS) analysis are given in Table 2. Comparison with the NPP measured data, and with the data obtained by the NPP code, “BISON” [14], developed by the reactor vendor (Westinghouse) and used by the NPP operators, are reported in the last column. It should be noted that the Boundary and Initial Conditions (BIC) for the NPP code are slightly different from the one used for the RELAP5-3D© simulation.
|
NAME |
Unit |
NPP |
NPP code (BISON) |
RELAP5-3D |
Rel. error |
|---|---|---|---|---|---|
|
Reactor Power |
MW |
1798.6 |
1802 |
1798.6 |
IMPOSED |
|
Steam Dome Pressure |
MPa |
6.93 |
7.00 |
6.94 |
0.12% |
|
Core Inlet Pressure |
MPa |
N/A |
7.166 |
7.095 |
-0.99% |
|
Core Outlet Pressure |
MPa |
N/A |
7.067 |
7.000 |
-1.00% |
|
Core ΔP |
kPa |
N/A |
98.8 |
98.4 |
-0.37% |
|
Core Average Void |
// |
N/A |
0.42 |
0.44 |
4.68% |
|
Core Average Fuel Temp |
K |
N/A |
816.67 |
854.63 |
4.65% |
|
Feed water Temperature |
K |
457.65 |
N/A |
457.65 |
IMPOSED |
|
Core Inlet Temperature |
K |
547.30 |
548.05 |
547.14 |
-0.03% |
|
Total Core Flow Rate |
kg/s |
5474.0 |
5515.9 |
5474.0 |
0.00% |
|
Active Core Flow Rate |
kg/s |
N/A |
4793.5 |
4759.9 |
-0.70% |
|
Steam Flow Rate |
kg/s |
900.0 |
976.0 |
904.6 |
0.51% |
|
K-eff |
// |
N/A |
1.0026 |
1.0021 |
-50 pcm |
In the following figures, some of the SS results are reported. In Figure 8, the 3D distribution of the fission power within the core (left) is shown. Also in Figure 8 (on the right), it can be seen how the central CR, almost totally inserted (from the bottom), flattens the radial power profile.
In Figure 9 (left), it can be noticed how the orifices of FA, calibrated according to the position in the core and to the FA type, redistribute the flow into the core. Also in Figure 9 (right), it can be seen how the exit void fraction is greater near the center and lower near the core periphery.
In Figure 10 instead, it can be noticed how the average value of the void fraction and the axial power shape factor calculated by RELAP5-3D© match with those calculated by the NPP code.
Transient analysis results
In the following figures, the results of the transient analysis are reported and compared with the measured data. The calculated parameters (Figure 11 and Figure 12) are in good agreement with the measured plant data and the deviations are acceptable. In particular, Figure 11 shows how, during the oscillations, the average value of the predicted power conservatively exceeds the measured one, probably due to uncertainties in the input data, which become more significant when the NPP status is far from the initial SS conditions.
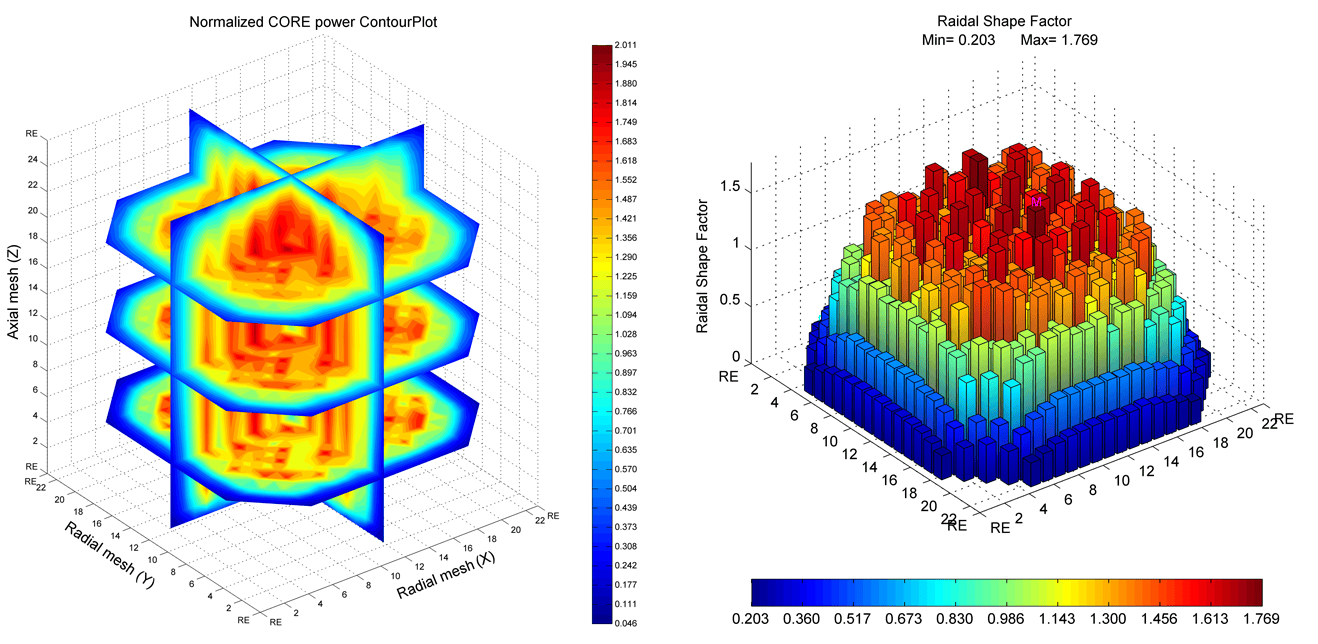
FIGURE 8 - Normalized Core Power and Radial Power shape factor
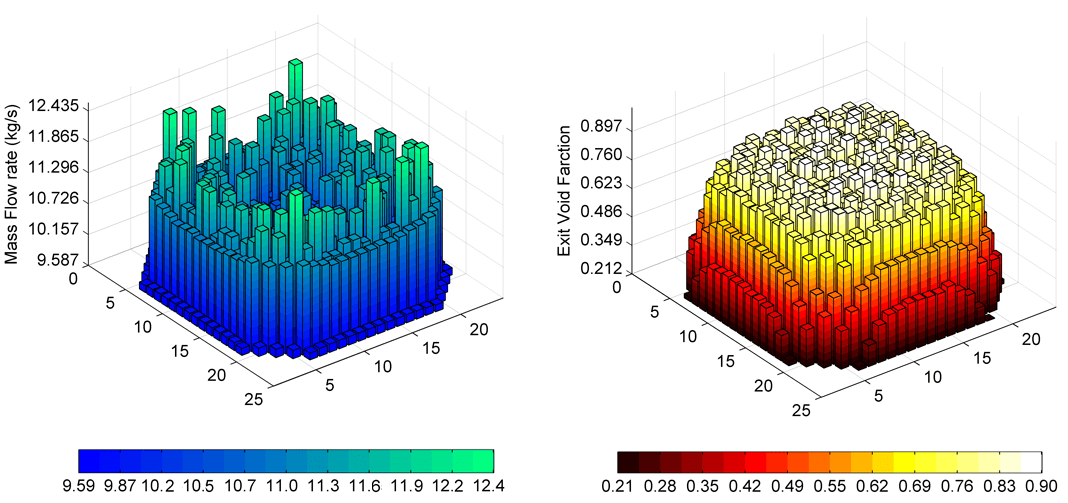
FIGURE 9 - Channels mass flow rate and exit void fraction
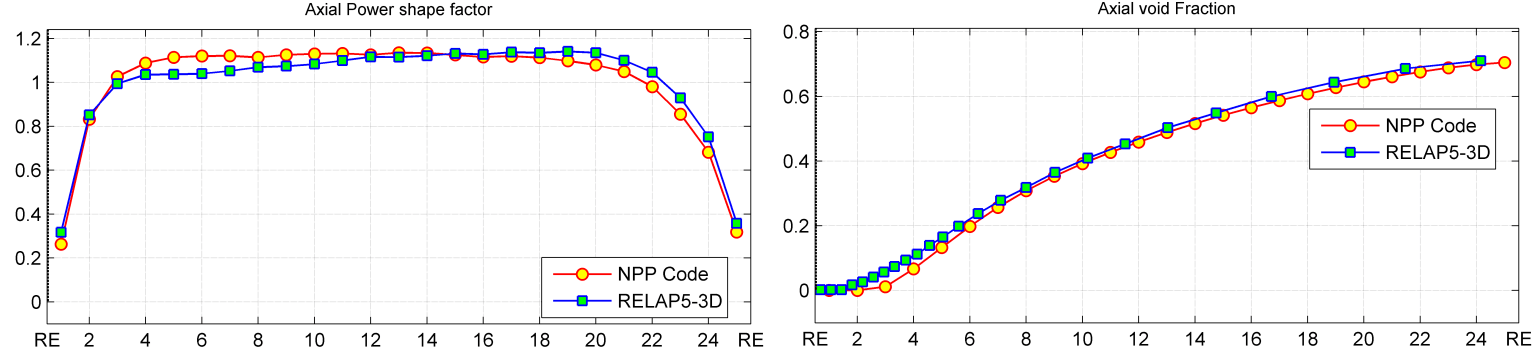
FIGURE 10 - RELAP5-3D vs. NPP code: Axial power shape factor (left) and Average axial void fraction (right)
Transient analysis results
In the following figures, the results of the transient analysis are reported and compared with the measured data. The calculated parameters (Figure 11 and Figure 12) are in good agreement with the measured plant data and the deviations are acceptable. In particular, Figure 11 shows how, during the oscillations, the average value of the predicted power conservatively exceeds the measured one, probably due to uncertainties in the input data, which become more significant when the NPP status is far from the initial SS conditions.
In Figure 13, four frames representing the variation of the calculated radial power distribution during a period of the instability event (about 2 s, or 0.5 Hz) are reported. These values are scaled to the SS values.
The three-dimensional analysis allows to identify the hot spot position into the core, and to monitor it during the transient. In our simulation the hot spot stays in the same channel, but, according to the nature of the density wave perturbation [8], it changes its axial position. The core maximum clad temperature and the core average clad temperature are shown in Figure 14.
The hot spot clad temperature is strongly influenced by the power oscillations after 250 s, rapidly increasing but never being of safety concern.
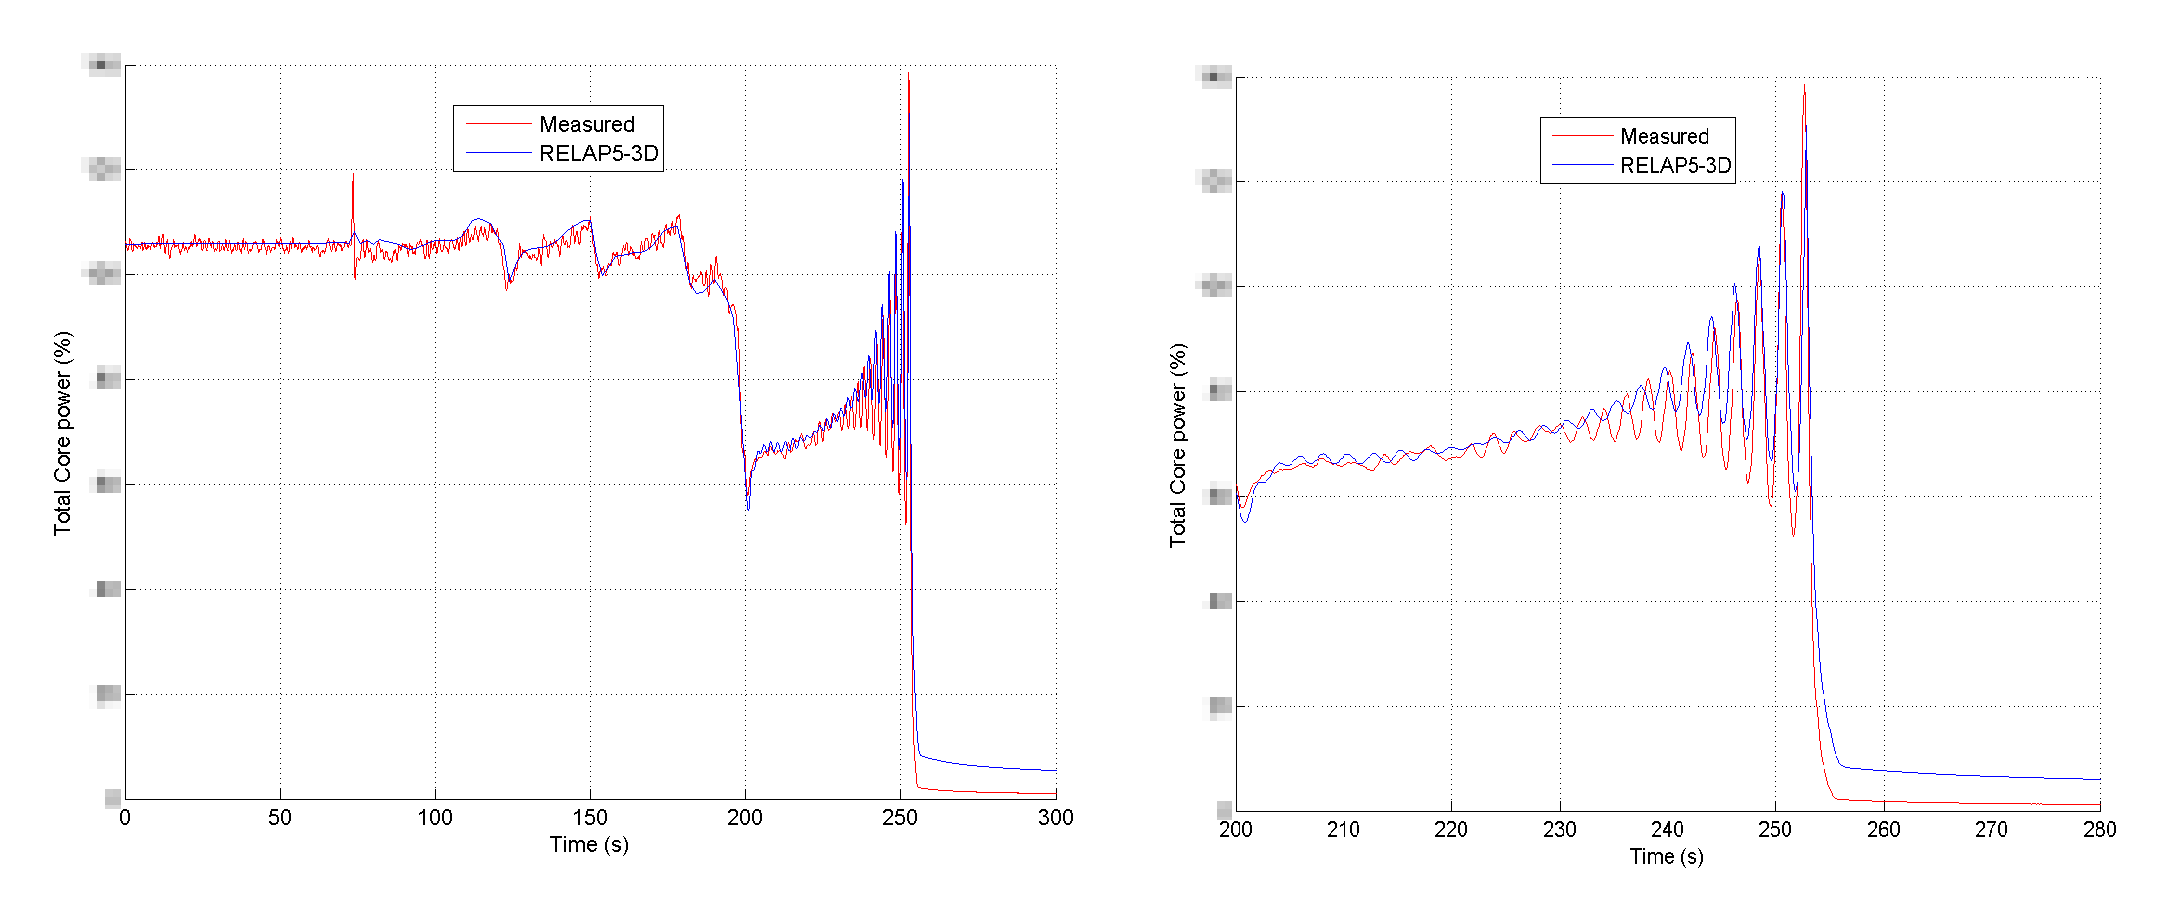
FIGURE 11 - February 25, 1999 transient: total core power (left) and the instability event (right), calculated vs. measured
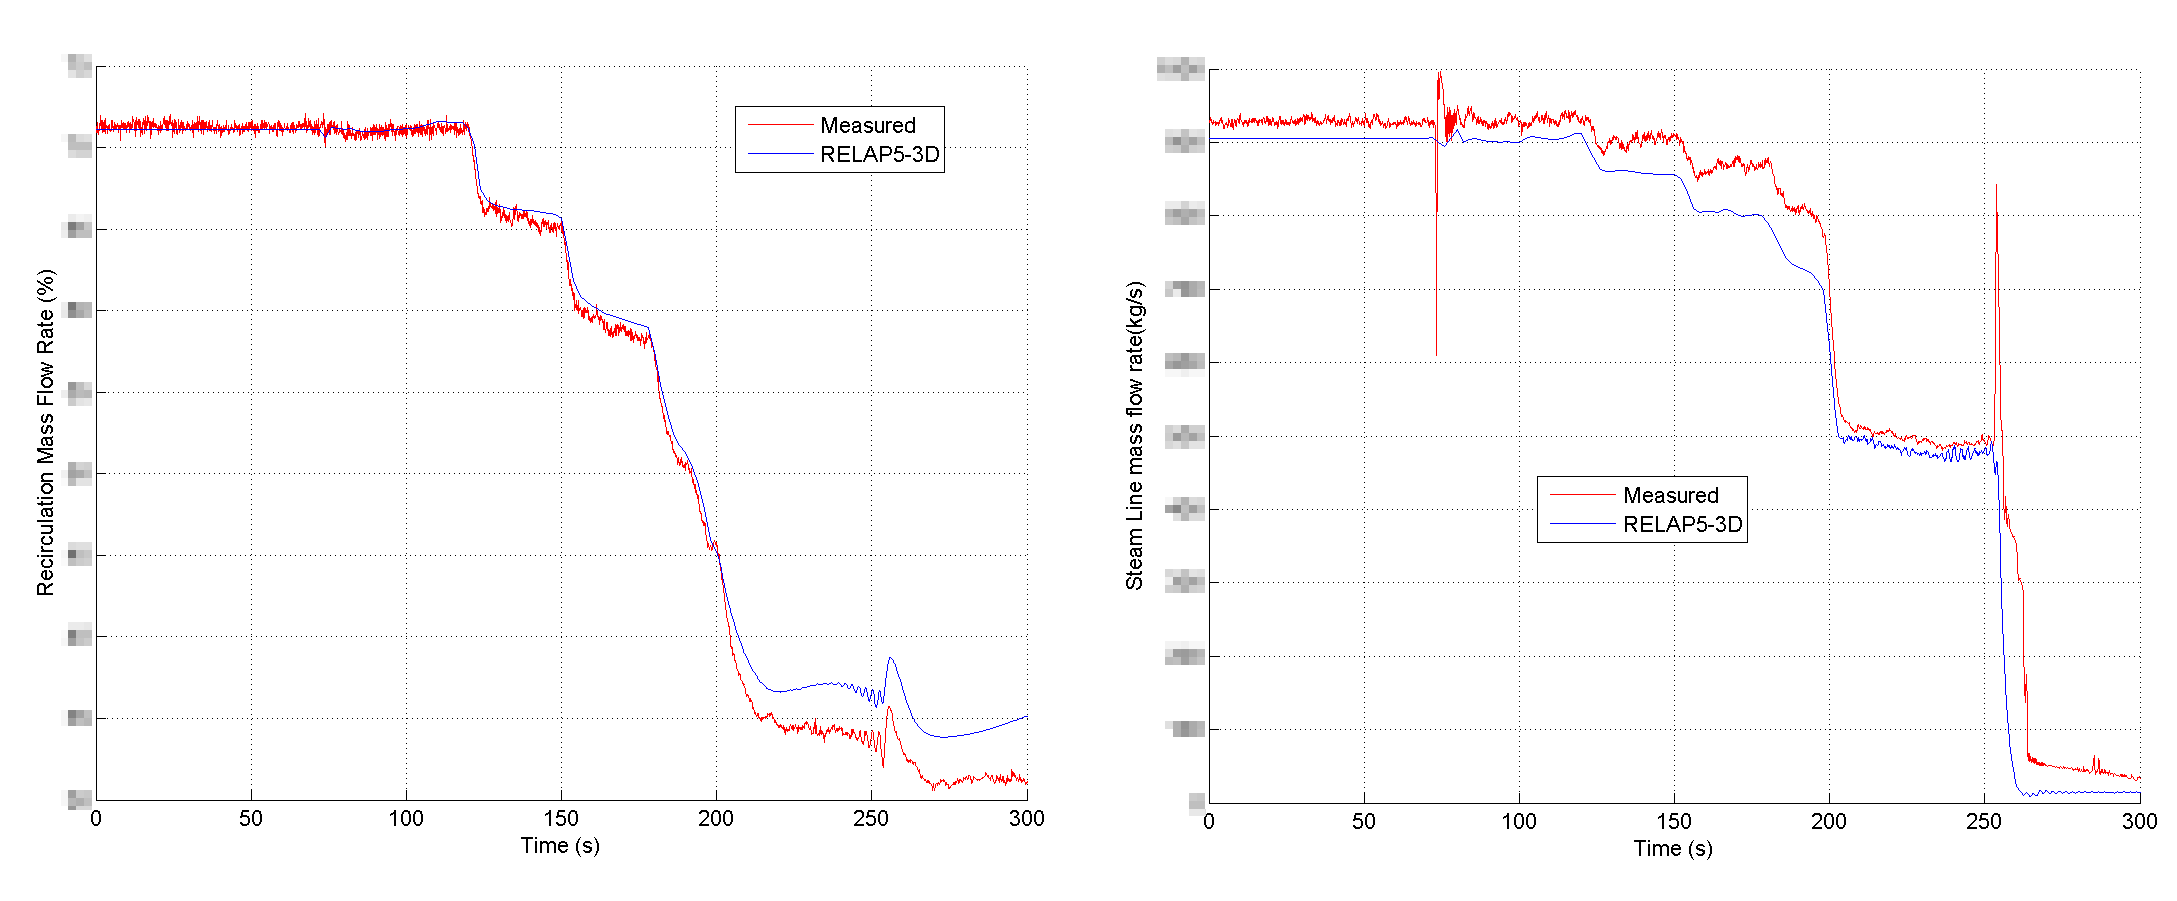
FIGURE 12 - February 25, 1999 transient: recirculation mass flow rate (left) and steam line mass flow rate (right), calculated vs. measured
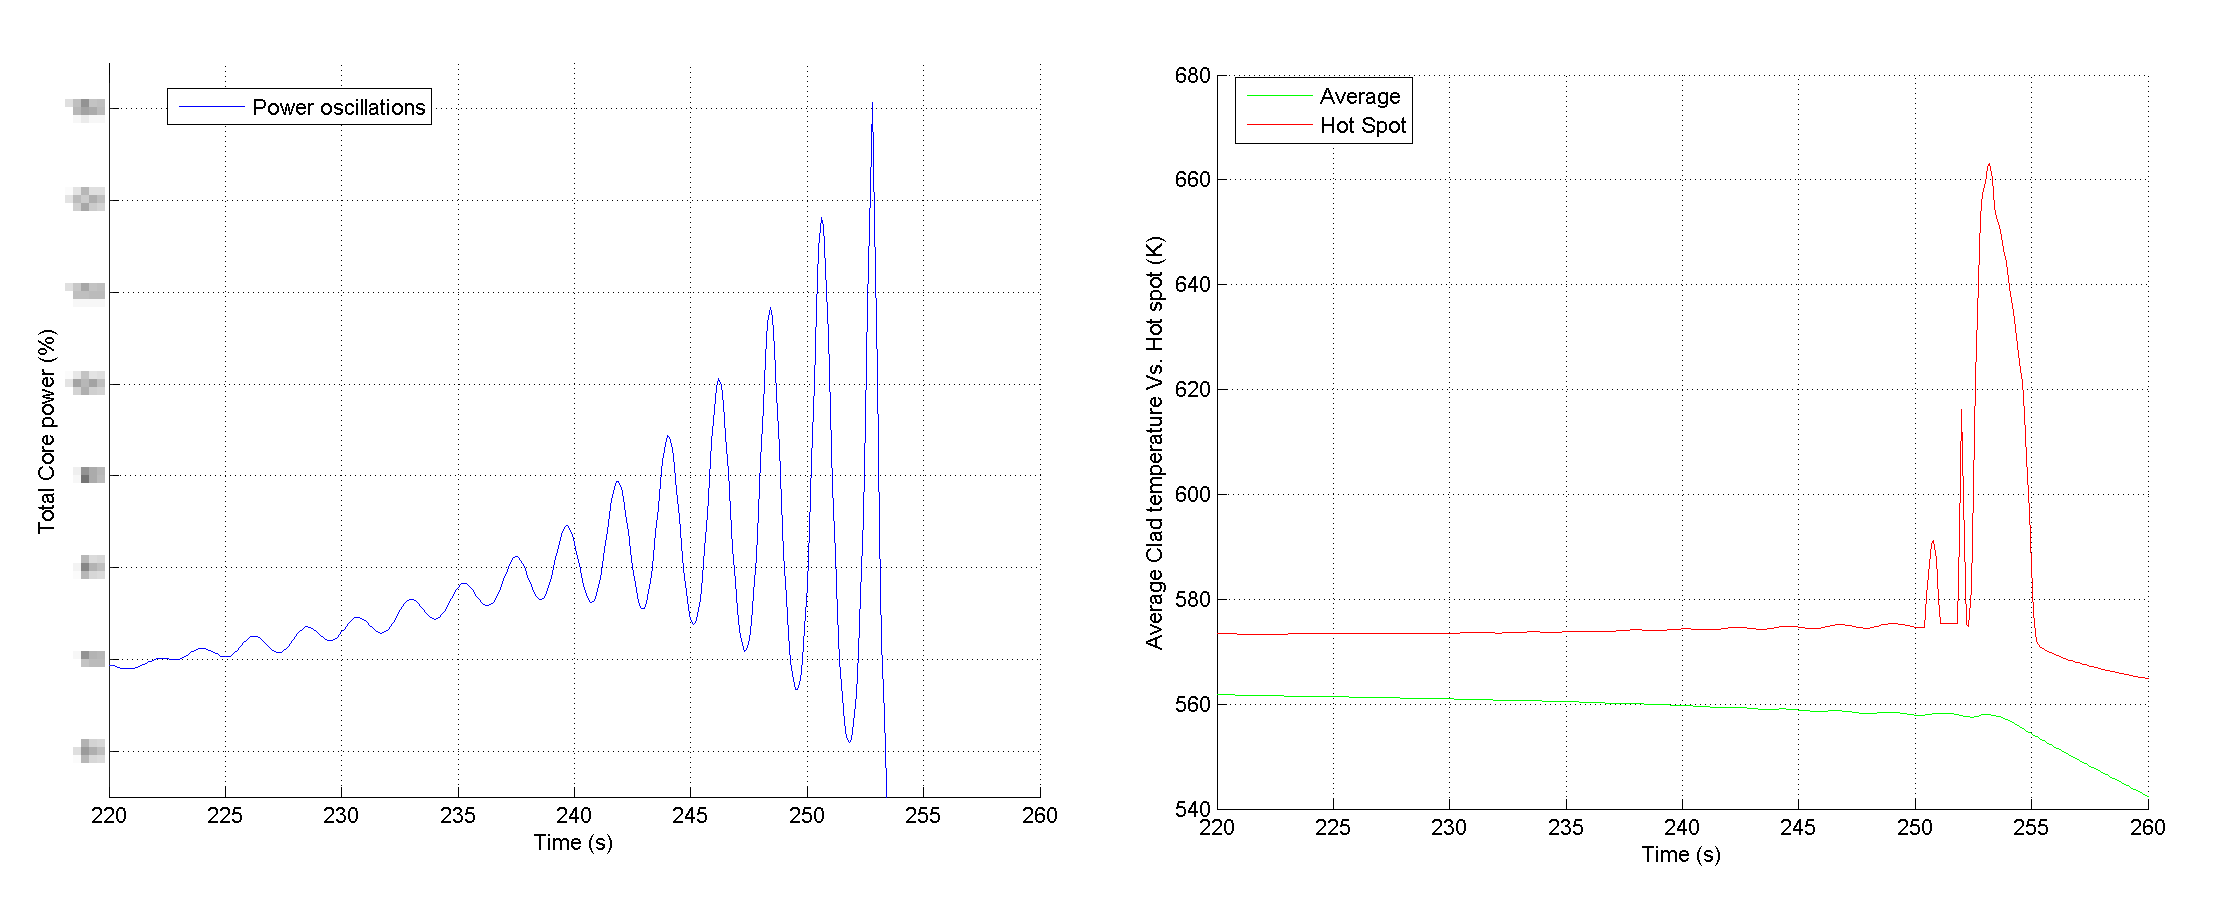
FIGURE 14 - Core averaged clad temperature vs. hot spot temperature
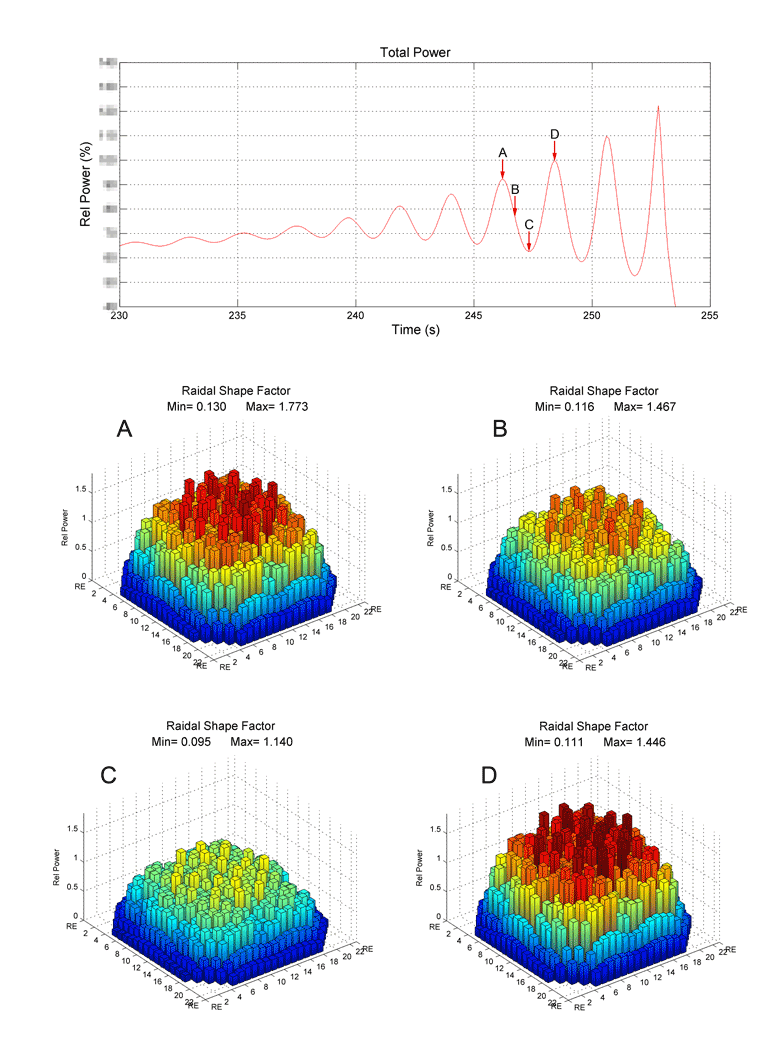
FIGURE 13 - Radial Power distribution during a period of the instability event
Conclusions
Main objective of this work has been the development of a state-of-the-art 3D NK TH model for studying BWR instability events by the BE RELAP5-3D© system code. The model and the transient analyses were qualified using plant data made available to the UTFISS-SIMING Lab of the ENEA “Casaccia” Research Centre in the framework of the OECD/NEA “Oskarshamn-2” international benchmark. The work activities demonstrated the BE capabilities of the RELAP5-3D© system code in reproducing the BWR instability events with a high degree of resolution.
Moreover, in order to perform such a simulation, a complete software platform has been developed for
- the management of the huge amount of data concerning the geometry of the reactor,
- the generation of RELAP5-3D©-compatible XSecs libraries (PROMETHEUS), and
- the generation of the more than 169,000 lines of the RELAP5-3D© input deck.
The benchmarking activities are still in progress, and future works will be devoted to:
- clarifying some relevant uncertainties (e.g., fuel gas gap conductance);
- performing blind calculations of some stability tests executed on the O-2 reactor three months before and three months after the event;
- simulate an “extreme scenario” (an Anticipated Transient Without Scram, or ATWS) based on the instability event;
- validate the auxiliary software developed to calculate the “Decay Ratio” and “Natural Frequency” of the power oscillations, or the FEDR tool (“Frequency Decay et Ratio calculator”), using the data of the “Forsmark 1 & 2” Benchmark supplied by the OECD/NEA;
- collaborate with the US-DOE Idaho National Laboratory in order to carry out instability simulations using the new advanced 3DNK code PHISICS (Parallel and Highly Innovative Simulation for INL Code System) [ 15].
References
[ 1] K. N. Ivanov, T. M. Beam, A. J. Baratta, A. Irani e N. Trikouros, “Pressurised water reactor Main Steam Line Break (MSLB) Benchmark”, Volume I: Final Specifications, OECD/NEA Report NEA/NSC/DOC(99)8, Paris, France, April 1999.
[ 2] J. Solis, K. N. Ivanov, B. Sarikaya, A. M. Olson e K. W. Hunt, “Boiling water reactor Turbine Trip (TT) Benchmark, Volume I: Final Specifications”, OECD/NEA Report NEA/NSC/DOC(2001)1, ISBN 92-64-18470-8, Paris, France, 2001.
[ 3] B. Ivanov, K. Ivanov, P. Groudev, M. Pavlova e V. Hadjiev, “VVER-1000 Coolant Transient Benchmark PHASE 1 (V1000CT-1), Vol. I: Main Coolant Pump (MCP) switching on. Final Specifications”, OECD/NEA Report NEA/NSC/DOC(2002)6, Paris, France, 2002.
[ 4] V. A. Tereshonok et al., «KALININ-3 Coolant Transient Benchmark – Switching-off of One of the Four Operating Main Circulation Pumps at Nominal Reactor Power - Specification», OECD/NEA Report NEA/NSC/DOC(2009)5, Paris, France, 2008.
[ 5] T. Lefvert, “BWR Stability Benchmark, Final Specification”, OECD/NEA Report NEA/NSC/DOC(94)15, Paris, France, March 1994.
[ 6] G. Verdu, M. J. Palomo, A. Escriva e D. Ginestar, “FORSMARKS 1 AND 2 Stability benchmark, Final Problem Specifications”, OECD/NEA Report NEA/NSC/DOC(2001)2, Paris, France, June 2001.
[ 7] F. D'Auria, W. Ambrosini, T. Anegawa, J. Blomstrand, J. In De Betou, S. Langenbuch, T. Lefvert and K. Valtonen, “State of the art Report on Boiling Water Reactor Stability”, OECD/NEA Report NEA/CSNI/R(96)21, Paris, France, 1997
[ 8] J. March-Leuba, “Density Wave Instabilities in Boiling Water Reactors”, Oak Ridge National Laboratory Report ORNL/TM-12130 (or NUREG/CR-6003), Oak Ridge, Tennessee, USA, 1992.
[ 9] I. Hideaki, F. Takanori, K. Yuichiro, S. Hideo and M. Shinya, “BWR Stability Issues in Japan,” Science and Technology of Nuclear Installations, Volume 2008, Article ID 358616, 11 pages, Hindawi Publishing Corporation, 2007.
[ 10] T. Kozlowski, et. al. ““BWR Stability Event Benchmark based on Oskarshamn-2 1999 Feedwater Transient”, OECD/NEA report (restricted access), 2012.
[ 11] F. D’Auria, G. M. Galassi and A. Bousbia Salah, “Neutronics/Thermal-hydraulics Coupling in LWR Technology, CRISSUE-S WP1 Project, OECD/NEA Report No. 4452, ISBN 92-64-02083-7, Paris, France, 2004.
[ 12] The RELAP5-3D© Code Development Team, “RELAP5-3D© code manual volume I: code structure, system models, and solution methods”, Idaho National Laboratory Report INEEL-EXT-98-00834, rev. 4.0, June 2005, Idaho Falls, Idaho, USA.
[ 13] J. D. Rhodes, K. S. Smith and D. Lee, “CASMO-5 Development and Applications”, ANS PHYSOR-2006 Conference, Vancouver, Canada.
[ 14] Westinghouse, Boiling Water Reactor Safety Analyses, NF-FE-0034, Cranberry Township, PA 16066, USA, May 2012.
[ 15] C. Rabiti, Y. Wang, G. Palmiotti, H. Hiruta, J. Cogliati e A. Alfonsi, “PHISICS: A New Reactor Physics Analysis Toolkit”, presented at the American Nuclear Society (ANS) Summer meeting 2011. Idaho National Laboratory Report INL/CON-11-21116, Idaho Falls, Idaho, USA, 2011.