

Landslide hazard assessment of the Messina Municipality area (Sicily)
A summary of the project results of the study led by ENEA in the area of Messina Municipality is presented in this paper. After the disaster occurred on October 1st, 2009, the Messina Municipality asked the ENEA team to make a landslide hazard assessment of its whole territory. The project actions have been addressed to both realizing a landslide inventory, a susceptibility map of triggering- and run out areas, an assessment of debris-mud flow intensity and identifying the triggering thresholds of debris-mud flows. The study is meant as a contribution to the development of a quantitative geomorphological approach in landslide investigation and an effective decision-support system for a sustainable urban planning of the area
Valutazione della pericolosità da frana del territorio del Comune di Messina (Sicilia)
In questo documento viene presentata una sintesi dei risultati del progetto condotto da ENEA nella zona del Comune di Messina. Dopo il disastro del 1° ottobre 2009, il Comune di Messina chiese al nostro team di effettuare una valutazione del pericolo di frana su tutto il suo territorio. Le azioni del progetto sono state mirate a realizzare un inventario dei fenomeni franosi, una mappa della suscettibilità delle aree di innesco e di accumulo, una valutazione dell’intensità delle colate rapide e delle soglie di innesco delle colate rapide. Lo studio costituisce un contributo allo sviluppo di un approccio geomorfologico quantitativo nelle studio delle frane e un efficace sistema di supporto alle decisioni per la pianificazione urbana sostenibile dell’area
Claudio Puglisi, Luca Falconi , Gabriele Leoni
Introduction
A community that wants to tackle the critical issues determined by a rampant urbanization needs to know about the environmental characteristics of its territory and, among these, the risk conditions which it is subjected to. Here are presented the results of the study led by ENEA in the Messina area (North-East Sicily) after the Giampilieri disaster occurred on October 1st, 2009, when heavy rainfall (over 200mm in 7 hours) triggered more than 1000 debris‑mud flows (Fig. 1), in an area of about 20 square kilometers. The flows hit 16 villages causing 37 casualties, 140 injured, 1642 evacuated and the interruption of national roads and railways. After this event the Messina Municipality asked the UTPRA-PREV team to make a landslide hazard assessment of its whole territory, to obtain a decision-support system for sustainable urban planning. The study has been addressed to properly model causative factors leading to an effective hazard assessment of both existing and potential phenomena[1]. Part of the study is limited to the debris-mud flows since they are the most common and destructive landslide typology in the area. Different tasks have been performed on the basis of the experience developed in more than ten years in many sites and at different scales: creation of a database containing information about historical and recent landslides (landslide inventory); identification of the areas prone to triggering landslides (susceptibility map) through the application of a heuristic method; assessment of debris-mud flow run out and intensity; identification of rainfall and pore saturation triggering thresholds.
Study Area
Messina municipality territory (220 square km) is located at the NE culmination of Peloritani Range. The northern part faces two seas: Mar Tirreno at NW and Mar Ionio at SE. The southern part is represented by the eastern side of Peloritani Mountains, that represent the southern termination of the Calabro-Peloritano arc. This chain is composed by seven metamorphic units (Kabilo Calabride Complex), of pre-alpine age and later involved in Hercynian and Alpine orogenic processes, and tectonically overlapping the sedimentary Maghrebidian units [2]. The rough morphology that characterizes the Peloritani mountains was mainly influenced by: the crystalline lithology, geostructural complex conditions related to orogenic tectonic, recent tectonic and still-in-progress strong uplift affecting the sector since late Miocene. All these conditions have morphologically influenced the area, generating high relief energy, narrow "V" valleys deeply incised, constantly deepening riverbeds often characterized by considerable morphological jumps.
Landslide Inventory
A landslide inventory represents a key point for urban and territorial planning, giving the chance to learn from the geological processes of the past events in the interpretation of the potential effects of present landslides [3]. In this respect, through the recording of data on historical and recent events, the landslide inventory of the Messina municipality has been created. A special contribution to the archive comes from the analysis of the ground effects induced by the December 1908 earthquake [4].
The historical archive collects information of landslides occurred during a period of time of approximately 500 years, between the XVI century and 2011, even if the vast majority (80%) of them took place between the 20th and 21st century. For this task, several local institutional libraries, local and national media, web sites, and scientific papers have been consulted. Two separate archives, the first containing 207 records relating to events that occurred from 1523 to 2011, and the second containing 61 records relating to events induced by the 1908 earthquake, have been registered in a GIS. For each landslide, the databases contain information regarding at least date and location and, whenever possible, the landslide typology, the resulting damage and the probable triggering factor, the data source and its reliability. Most events (60%) are classified as debris-mud flow and are located in Aspromonte Units. Most part of the 1908 catalogued landslides fell in the Messina urban area because the technical reports were addressed to the inhabited areas more than to the mountain and rural zones.
The geomorphologic survey has been carried out by digital stereoscopic air photo interpretation on 2007 flight, GIS photointerpretation of 2009 and 2010 orthophoto and field surveys on events from 2009 until 2012. More than 3000 landslides of 4 typologies [5] have been surveyed in an area of 220 km2 (Fig. 2): debris-mud flows (74%), rock falls (17%), rotational slides (7%) and translational slides (2%). For each landslide typology those factors of geomorphological, lithological, morphometric, structural and land use order were detected.
Data considered of high and very high reliability can help to enhance existing regional and national inventories. The information on the landslide factors constitutes the basis for the definition of the geomorphological susceptibility map of the area [6]. Lastly, data recorded in the archive are the propaedeutic basis necessary to determine the landslide rainfall thresholds.
Susceptibility
The landslide susceptibility assessment consists in the identification of the areas where potential phenomena could happen in the future. In this study an heuristic methodology has been applied, based on the knowledge of past events and local conditions, acquired by an appropriate field survey [7, 8, 9]. The statistical analysis of the landslide inventory leads to identify particular conditions and their mutual relationships, distinguished as "discriminating parameters" (conditions necessary for slope instability), or "predisposing factors" (all other conditions that work together in worsening slope stability). The former, commonly lithology and slope angle, indicate potential susceptible zones, whereas the latter contribute to quantify the susceptibility degree. Once the causes have been recognized, it is possible to extend the approach to similar areas, to find those affected by the same hazardous conditions. Finally The GIS overlay of indexed maps, representing each known factor that affects slope instability, points out a potential triggering area of landslides.
The descriptive statistical analysis showed low reliability for slow slope movements (rotational and translational slides) depending on the small statistical sample, about 200 and 50 events, respectively. For all phenomena, the statistical analysis pointed out the great significance of lithology and slope angle: these two discriminating parameters show a great differentiation between class values with and without associated events. Discriminating parameters associated with debris-mud flows, in the study area, are all lithologies, except clays and chalks, for slope angle varying from 17° to 73°, while for rock falls the associated discriminating parameters are all pre-quaternary deposits for slope angle greater than 26°.
Given the general framework of discriminating parameters, which outlines potential susceptible and non-susceptible areas, there are some landslide factors more recurrent than others: these conditions represent the predisposing factors. In most cases, debris‑mud flows occur in Miocene Flysch and in metamorphic Units (except Marbles), with slope angle ranging from 36° to 59°, weakly convex-shaped slopes, terraced areas with low or no vegetation and areas close to natural or artificial slope breaks. For rock falls, predisposing factors are represented by Miocene coarse-grained Flysch, Plio‑Pleistocene Calcarenites and metamorphic Units (except Phyllites), with slope angles greater than 40°, strong convex-shaped slopes, no vegetation and artificial slope breaks.
The susceptibility function summarizes predisposing factor indices producing the map of the spatial distribution of susceptibility index for the whole study area. For debris‑mud flows (Fig. 3) high and very high susceptibility areas are located in the central and southern zones of Messina Municipality, already hit by the 2007, 2009 and 2010 events, and in the northern zone, close to neighboring Municipalities hit by the 2011 event.
In this framework, the correlation between the spatial occurrence of observed debris-mud flows and the soil erosion susceptibility, as expressed by the synthetic RUSLE index, has been analyzed in three small catchments located in the Messina study area. Two different statistical approaches based on logistic regression analysis have been compared: the general logistic regression analysis and the spatially-constrained logistic regression. Notwithstanding some limitations given by the lack of a detailed soil survey and the poor consistency of the current rain observation network, the outcomes appeared satisfactory and very encouraging to carry on with further investigations.
Debris-Mud Flow Run Out
Especially important for prevention activities is to recognize the potential path of the debris-mud flows from the triggering point to the stop. The run out distance of a huge number of debris-mud flow, occurred after 2007 in the Messina Municipality area, was calculated following the literature approach [10, 11]. The mobilized volume multiplied by the altitude difference (∆h) between the triggering point (Piff) and the stop point (Pip), in abscissa, and the distance traveled by the phenomena from the Piff to Pip in the ordinate were plotted. To estimate the volume of each single occurred phenomena, the product of the maximum depth of failure surface (which varies from 0.2 to 1.5 m.) by the triggering area, derived by photo interpretation, was calculated; such product has then been reduced through an experimentally-obtained correction factor of the niche shape, equal to 0.62. Aiming to avoid leaving out the mobilized volumes in the transit areas and following field observations, an average thickness values of these zones were considered variables from 0.2 to 1m. Because of their significant kinematics difference, channelled and unchannelled phenomena have been analyzed separately. The equations of the interpolation lines derived from the two graphs are as follows:
- Channelled phenomena: y = 4.861x0.329 with a mean square error of R² = 0.894
- Unchannelled phenomena: y = 3.127x0.341 with a mean square error of R² = 0.817
Comparing these equations with those proposed by Rickenmann, it appears that, for equal volumes mobilized and equal altitude difference between the triggering point and the stop point, the run out distance in the Peloritani area is lower than in other regions.
Subsequently, these formulas have been revised to make the applicability to potential phenomena more effective and easier to use. With this aim it has been chosen to substitute the stop point of the flow with the foot of the slope, where the speed of the mobilized mass starts decreasing to lose its erosive power and to deposit material. In a first approximate analysis, the foot of the slope has been identified with the contour line of the slope angle equal to 28°.
New charts have been elaborated, where in the abscissa the product of mobilized volume multiplied by the altitude difference (∆h) between the triggering point (Piff) and the foot of the slope (28° contour line) was placed. The equations of the interpolation lines derived from these new graphs are the following (Fig. 4):
- Channelled phenomena: y = 5.049x0.329 with a mean square error of R² = 0.887
- Unchannelled phenomena: y = 3.099x0.346 with a mean square error of R² = 0.807
A confirmation of the reliability of this new processing was carried out by comparing the original equations and their evolution, which indicates an excellent agreement between the curves. Therefore, given the volume of the potentially mobilized material and basing on these curves, it is possible to calculate the run out of potential debris-mud flows with a good approximation.
Debris-Mud Flow Intensity
The intensity expresses the destructive capacity of a phenomenon, essential datum to design suitable protection structures. It may be expressed in a relative scale, referring it to damage or loss degree, or in terms of characteristic variables of the phenomenon (e.g., speed, volume, energy) [12]. According to the methodology, the intensity is considered as equal or proportional to the kinetic energy developed by the landslide, since the ratings for speed and size may be partial.
During the field survey several points were identified in order to measure the speeds achieved by the debris-mud flows occurred in October 1, 2009. Adopting the Johnson & Rodine approach [13], it was possible to estimate the average speed of a flow by measuring the raising that occurs in the outer portion of a curve due to the centrifugal force. The identified measurement points were characterized by the presence of traces left by the transit of the flow, like mud deposits or abrasions in the tree bark. Applying the Johnson & Rodine formula to different points of the mud-debris flow paths, specific velocities were calculated, in order to outline the deceleration curves for different occurred debris-mud flows. Maximum speed values range between 8 and 16 m/s.
Along the path traveled by the considered flow, at each point where speed was calculated, the value of developed kinetic energy was obtained. By calculating the product of the mass – equal to the product of the volume by the average density (estimated as 2000 kg/m3) – by the speed, maximum developed energies were estimated in the order of thousands of kilojoules. Finally, volume, distance of propagation and velocity were estimated for several potential phenomena identified by the susceptibility map, in order to estimate the potential energy in different points along the path in which new phenomena could develop (Fig. 5).
Rainfall Thresholds for Debris-Mud Flow
The analysis of the triggering thresholds is aimed at answering the question of when an event can take place. Based on the historical information on rainfall – the main triggering factor of this type of landslides – the triggering thresholds of debris-mud flows have been investigated with the aim to provide additional elements to the knowledge of the critical rainfall, useful for developing effective early warning systems [14, 15].
The study was based on the daily rainfall data of the Waters Observatory of the Sicily Region and on a database of 46 debris-mud flows occurred between 1933 and 2011. The temporal distribution of the 46 debris-mud flows indicates a concentration in the autumn months, with a maximum in October.
The data used in the elaboration were annual normalized values of the rainfall in the day of the event, compared with those of 1, 2, 6, 14 and 29 preceding days. The debris-mud flow events have been divided into two subsets based on the number of concurrent records in the same date. The trend lines of the distribution of the normalized values of these two subsets have permitted to distinguish 3 different fields of severity (Fig. 6). It is remarkable that the most significant recent events are always positioned above the high severity daily threshold line.
The current landslide real-time monitoring, particularly for debris-mud flows, are mainly based on the measurement of rainfall. Nevertheless, the factor most directly related to the triggering of this landslide typology is the soil moisture level, which not only depends on the intensity of rainfall in a given moment, but also on the thermo-precipitation regime of the previous period. By coupling rainfall and soil water content data, the study would contribute to the development of more effective early warning systems for debris-mud flows. Precipitation data of the event of October 1, 2009 and of other more recent events registered by the Sicilian regional rain gauges network were used. The state of soil saturation was investigated by installing FDR probes (Frequency Domain Reflectometry) in June 2012.
Soil has been sampled in correspondence of the levels where the FDR probes have been placed. In general, they have low clay content, sandy in shallow levels and finer in the deepen horizons. Being in correspondence of metamorphic parent materials, consisting of shales and phyllites, these soils generally have thixotropic properties. After the measurement of the mass density, the soils were brought to saturation, showing a water content ranging from 19% (37% of skeleton) to 43% (2.5% in skeleton).
The measurement of the gravimetric water content, carried out with the pressure plate extractors [16], allowed to estimate the water content in the immediate surroundings of the event of 1 October, 2009. Once having determined the hydrologic boundary conditions [17], the water retention capacity was calculated as the difference between maximum water content (WCsat) and field capacity (WCCC) for each horizon and, then, for the entire soil thickness. The modeling conducted with a simplified method has shown that, at the moment of the triggering of debris-mud flows of October 1, 2009, the soil above the slopes of the study area reached the pore saturation. The responses of the twelve FDR probes seem to confirm the data modeling, showing in some cases a marked sensitivity to the rainfall input.
Conclusions
The morphology of Messina’s territory, the development of towns and villages up to creek outlet, the transformation of riverbed in street and the abandonment of terracing have contributed to increase the geomorphological risk of the area. The study provided a framework of the degree of landslide hazard in the territory of Messina and will constitute a necessary basis for the definition of sustainable risk mitigation actions. The proposed methodology is a contribute to the development of a quantitative geomorphological approach in landslide investigation. In particular, it is worth mentioning that:
- although the registered events contained in the landslides inventory have different significance according to the different reliability of the sources and to the dissimilar detailing level of the reported description, they represent, by the way, a valid tool not only for experts in the sector but also for anyone who may face the issues linked to the geomorphologic risk assessment;
- the heuristic method for susceptibility assessment integrates multidisciplinary knowledge, both quantitative and qualitative. Furthermore, it allows the use also by operators lacking specific statistical or modeling expertise, it can be explained easily to stakeholders and gives a framework of large areas, pointing out the emergencies that need prior response;
- by applying the site-specific formulas, it is possible to estimate the run out distance of the mobilized material of the potential triggering areas. This tool is especially useful for land planning and civil defense policies;
- although it is necessary to perform site-specific analysis in order to assess the energies expected with the accuracy required for site operations, the results of this study provide a rough estimate of the energy that can be developed from the triggering of debris-mud flows in the area;
- although it is necessary to recognize the limitation of this study, constituted by the small size of both daily and hourly dataset, the rainfall threshold analysis has yielded significant results for the study area, correlated with similar studies conducted in other areas proposed by several authors;
- the study on the soil saturation threshold is still at an early stage and the results have strong limitations, relating mainly to the small size of the dataset. However, it is possible to presume that it can provide useful data for future implementation of the early warning monitoring stations that can be used for the specific purposes of Civil Protection.
Acknowledgements
This study was funded by the Municipality of Messina. Dr. Carmelo Gioè, geologist of the Municipality of Messina, is sincerely thanked for the support he provided to the study. The interpretation of the geology of the study area and the elaboration on the soil saturation processes greatly benefited from the support of the PhDs Pino Paolo and Rosario Napoli. The authors are grateful to Elisa Brustia, Valerio Comerci, Mauro Lucarini, geologists from ISPRA, for their contribution about the ground effects of the Messina earthquake of 1908. Field activities, GIS elaboration and aerial photo interpretation could not be achieved without the efforts made by Danilo Campolo, Silvia Lumaca, Simona Malerba and Antonino Torre, young Sicilian geologists. Finally, special thanks are due to Cinzia Crovato, Sergio Grauso, Augusto Screpanti, Vladimiro Verrubbi, Alessandro Zini, colleagues from ENEA, for their contribution to laboratory physical analysis, RUSLE elaboration and GPS measuring.
References
- Puglisi C., Falconi L., Grauso S., Screpanti A., Verrubbi V., Zini A., Crovato C., Campolo D., Leoni G., Lumaca S., Malerba S., Brustia E., Comerci V., Lucarini M., Napoli R., Torre A., Pino P. (2013). Valutazione della pericolosità da frana nel territorio del Comune di Messina. ENEA RT-2013-18, Roma, 161 p. http://hdl.handle.net/10840/4771
- Lentini F., Catalano S., Carbone S. (2000). Nota illustrativa della Carta geologica della Provincia di Messina (Sicilia Nord-Orientale). Scala 1:50000. S.EL.CA, Firenze. 70 pp.
- Bach Kirschbaum D., Adler R., Hong Y., Hill S., Lerner-Lam A. (2010). A global landslide catalog for hazard applications: method, results, and limitations. Nat Hazards (2010) 52:561–575. DOI 10.1007/s11069-009-9401-4
- Comerci V., Blumetti A.M., Brustia E., Di Manna P., Fiorenza D., Guerrieri L., Lucarini M., Serva L., Vittori E., 2008, The effects on the environment of the 1908 Southern Calabria – Messina earthquake (Southern Italy). In: Di Bucci D., Neri G., Valensise G. (a cura di), Riassunti estesi del Convegno “1908 – 2008 Scienza e Società a cento anni dal grande terremoto”, Dipartimento Protezione Civile, Università di Messina, INGV. Reggio Calabria 10-12 dicembre 2008. Miscellanea INGV, Anno 2008_Numero 03
- Varnes D.J. & IAEG Commission on Landslides (1984). Landslides Hazard Zonation – a review of principles and practice. UNESCO, Paris, 63 pp.
- Calcaterra D., Parise M., Palma B. (2003). Combining historical and geological data for the assessment of the landslide hazard: a case study from Campania, Italy. Natural Hazards and Earth System Sciences (2003) 3: 3–16. European Geosciences Union 2003
- Casagli N., Catani F., Puglisi C., Delmonaco G., Ermini L., Margottini C. (2004). An Inventory-Based Approach to Landslide Susceptibility Assessment and its Application to the Virginio River Basin, Italy. Environmental & Engineering Geoscience, X (3)
- Abbattista F., D’Agostino G., Delmonaco G., Di Filippo L., Falconi L., Leoni G., Margottini C., Puglisi C., Romano P., Spizzichino D. (2005). La valutazione della suscettibilità da frana: applicazione alle colate rapide di Cervinara (AV). Geologia tecnica & ambientale, n°1/2005. ISSN 1722-0025
- Leoni G., Barchiesi F., Catallo F., Dramis F., Fubelli G., Lucifora S., Mattei M., Pezzo G. & Puglisi C. (2009). GIS methodology to assess landslide susceptibility: application to a river catchment of Central Italy. Journal of Maps, v2009, 87-93. 10.4113/jom.2009.1041
- García-Ruiz J.M., Beguería S., Lorente A., Martí C. (2002). Comparing debris flow relationships in the Alps and in the Pyrenees. Instituto Pirenaico de Ecología, Zaragoza, Spain
- Rickenmann D. (1999). Empirical Relationships for Debris Flows. Natural Hazards, 19: 47–77
- Jakob M. (2005). A size classification for debris flows. Engineering Geology, 79 (3-4), pp. 151-161.
- Johnson A.M. & Rodine J.R. (1984). Debris flow slope stability. Editors Brusden D. & Prior D.B., p. 257-361. John Wiley and Sons, New York
- Aleotti P. (2004). A warning system for rainfall-induced shallow failures. Engineering Geology, Volume 73, Issues 3–4, June 2004, Pages 247–265
- Basile G., Panebianco M. (2011). Experimental alert model for hydrogeological risk: a case study in Sicily. Proceedings of the Second World Landslide Forum – 3-7 October 2011, Rome
- van Genuchten M.Th., Leij F.J., Yates S.R. (1991). The RETC Code for Quantifying the Hydraulic Functions of Unsaturated Soils. Environmental Protection Agency Report n. EPA/600/2-91/065, pp. 92.
- Aronica G. T., Brigandì G., and Morey N. (2012). Flash floods and debris flow in the city area of Messina, north-east part of Sicily, Italy in October 2009: the case of the Giampilieri catchment. Nat. Hazards Earth Syst. Sci., 12, 1295–1309, 2012. doi:10.5194/nhess-12-1295-2012
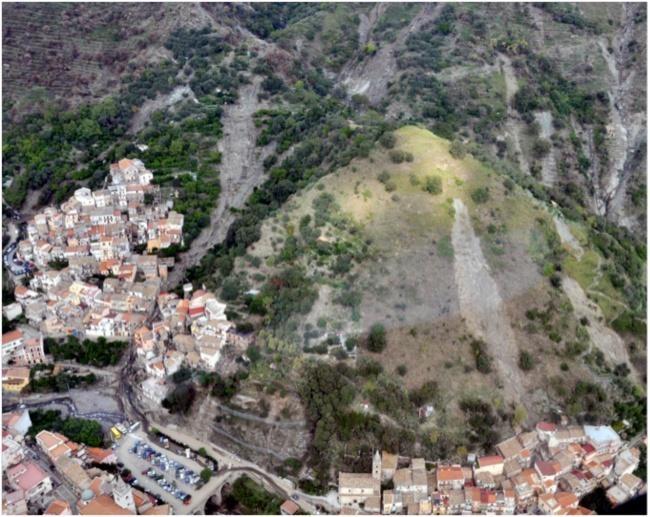
FIGURE 1 - Some debris-mud flows occurred in the area on October 1st, 2009
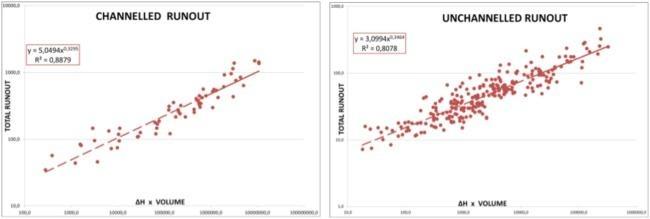
FIGURE 4 - Site-specific run out equations for channelled and unchannelled debris-mud flows
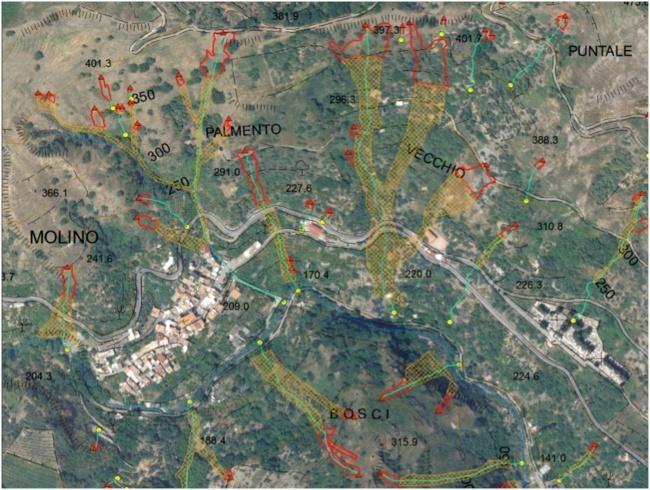
FIGURE 2 - Example of the georeferenced features of some debris-mud flows contained in the inventory (red triangle: triggering point; yellow dot: stop point; red line: triggering area; orange hatched: transport and depositional area; green line: run out path)
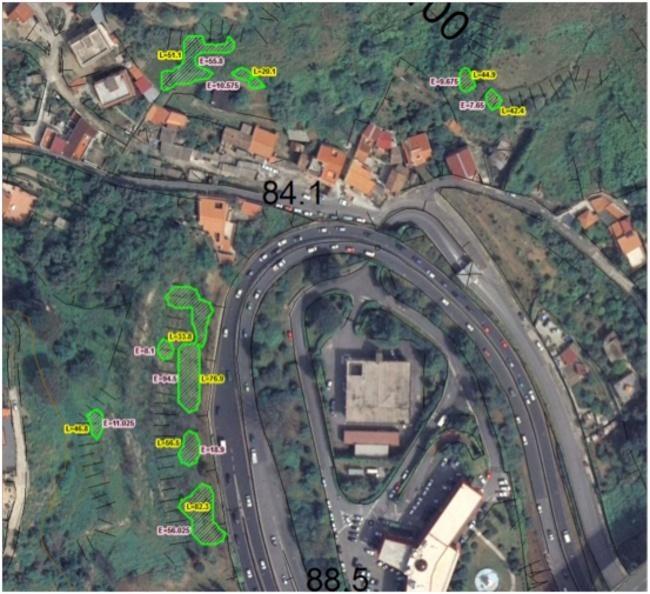
FIGURE 5 - Very high susceptibility areas (green) with the propagation distances expressed in meters (yellow) and the maximum kinetic energy expressed in thousands of kilojoules (pink)
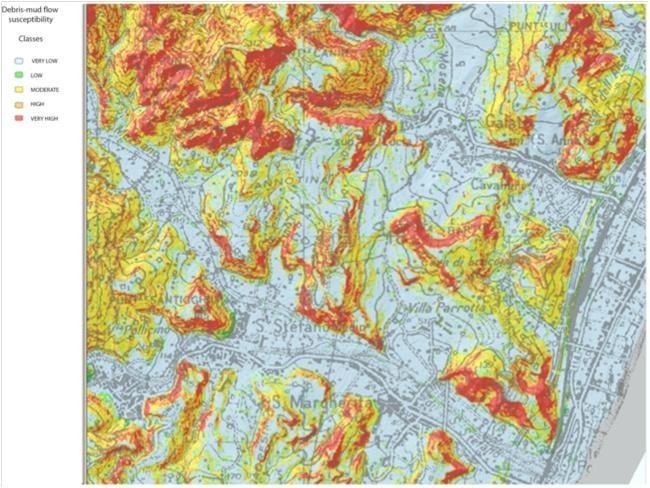
FIGURE 3 - Detail of susceptibility map for debris-mud flow typology
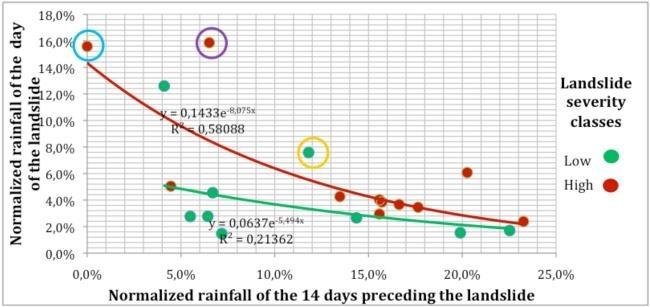
FIGURE 6 - Normalized rainfall of the day of landslides occurrence and of the previous 14 days. The recent disastrous events of 07/09/2000 (blue circle), 01/10/2009 (purple circle) and 25/10/2007 (orange circle) have been highlighted